Exploring The Benefits of Real-Time Heatmaps In Business Intelligence

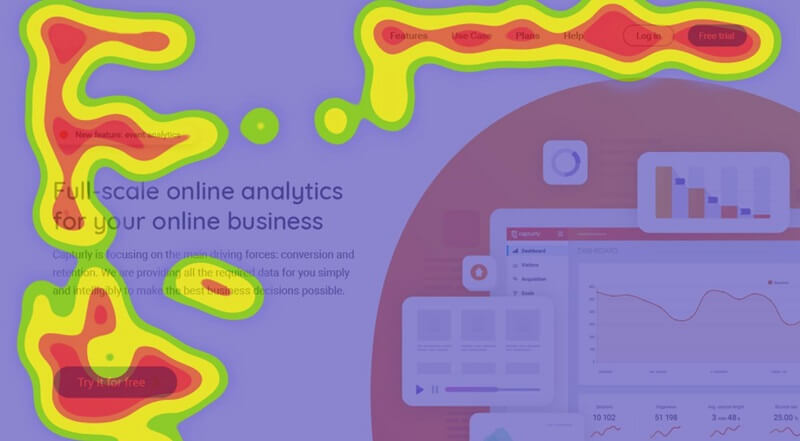
Heatmaps are an invaluable tool for understanding website visitor behavior. Get an in-depth look into the real-time heatmaps benefits in business intelligence. So keep reading.
For many contemporary firms, business intelligence is a crucial success factor. With the development of big data and sophisticated analytics, organizations are now able to make data-driven choices that boost productivity, enhance customer experiences, and raise revenues.
The real-time heatmap is one technique that has grown in popularity lately. Heatmaps help organizations spot patterns, track performance, and quickly make choices by giving a visual representation of data in real-time.
In this post, we’ll examine the advantages of real-time heatmaps for business information and how to use them to your advantage in the hectic corporate world of today.
What is Business Intelligence?
Business intelligence, or BI for short, is the process of gathering, examining, and using data to help company decision-makers make well-informed choices that lead to success.
Order to uncover patterns and trends that might guide corporate strategy entails compiling data from a variety of sources, including customer interactions, sales numbers, market trends, and social media activity.
The purpose of business intelligence (BI) is to deliver useful information that firms can use to enhance performance, make better choices, and gain a competitive edge in their particular markets.
BI uses a variety of tools and methods, including data mining, predictive analytics trends, data visualization, and reporting, to do.
One of BI’s main advantages is its capacity to present a comprehensive picture of a company’s activities. Business intelligence (BI) enables organizations to view the broad picture and pinpoint areas for development by combining data from many sources.
For instance, a business may watch sales data across several product lines using BI, discover the best-selling items, and modify its inventory appropriately. Real-time opportunity and risk identification are other advantages of BI.
Businesses that have access to the most recent data and analytics tools may immediately spot new trends, market movements, and client preferences and modify their strategy as necessary. For instance, a chain of hotels may monitor social media and internet reviews to find and handle consumer problems.
BI is a useful tool for success monitoring and performance evaluation as well. Businesses may make sure that they are on track to accomplish their goals by establishing key performance indicators (KPIs) and monitoring their progress against them.
For instance, a software business may analyze customer satisfaction scores and pinpoint areas for improvement using BI.
Heatmap Tools for Higher Performance
Making data-driven decisions that promote development and success is more crucial than ever for businesses in the fast-paced business world of today. The heatmap is one tool that can assist organizations in achieving this objective.
Heatmaps help organizations detect trends, track performance, and quickly make choices by giving a visual representation of data. In this post, we’ll look at how heatmap tools may improve operational efficiency and provide businesses with a competitive edge.
The Real-Time Heatmaps Benefits In Business Intelligence:
Identifying Trends and Patterns
Businesses may use heatmap tools to find patterns and trends in their data that might not be immediately obvious. Heatmaps provide for the clear and succinct visualization of data, enabling organizations to see trends that might not be apparent in more conventional reports or spreadsheets.
Businesses may improve their websites for better performance by using tools like website heatmaps; which can show them where parts of their sites are receiving the most hits.
Monitoring Performance in Real-Time
Businesses may gain instantaneous insights into their performance using heatmap technologies. Businesses may immediately discover areas where they need to improve and make modifications on the spot by collecting key performance indicators (KPIs) and displaying data in real-time.
Moreover, businesses may alter their social media strategy in real time by using tools like social media heatmaps, which can show them which postings are receiving the most interaction.
Improving User Experience
Businesses may also enhance the user experience by using heatmap technologies. Businesses may see places where customers may be having trouble or running into obstacles by monitoring user activity on their website or mobile application.
The UX may then be improved using this data in order to boost user pleasure and engagement. A heatmap of a mobile app, for instance, might assist firms to identify the most popular features and choose where to focus their future development efforts.
Optimizing Marketing Campaigns
By offering insights into customer behavior, heatmap technologies may assist firms in optimizing their marketing initiatives. Businesses may determine what works and what doesn’t by measuring client interactions with advertisements, web push notifications, and website content. They can then modify their campaigns appropriately.
A heatmap of an email campaign, for instance, might show companies which links are receiving the most hits and assist them in optimizing subsequent letters for higher interaction. Tools like heatmaps may be a valuable resource for companies wanting to improve performance and acquire a competitive edge.
Heatmap tools may assist organizations in making data-driven decisions that promote development and success by offering insightful data on consumer behavior, website performance, and digital marketing efforts.
Using heatmap tools in your business plan will help you reach your objectives and stay one step ahead of the competition, regardless of how big or small your company is.

Types of Heatmaps
Heatmaps are a widely used data visualization tool that gives organizations a visual depiction of complicated data. With the use of heatmaps, users may easily see patterns and trends in huge datasets by using color to represent values.
Businesses may utilize a variety of heatmap kinds, each of which has special advantages and uses. So, we’ll discuss the many kinds of heatmaps and their applications in business in this post.
Standard Heatmaps
The most popular kind of heatmaps is those that look like this. Each cell of the 2D matrix serves as a data point, and the values are represented by color.
Besides this, Large datasets may be shown using standard heatmaps, which can help to spot patterns and trends in the data. They are frequently used in industries including banking, medicine, and scientific research.
Geo Heatmaps
Color is used in geographic heatmaps to denote values on a map. For displaying location-based data, such as sales numbers, customer locations, or demographic information, they are helpful.
When determining where there is a high level of consumer demand or when focusing on advertising campaigns, they are frequently employed in marketing and advertising.
TreeMaps
A sort of heatmap called a treemap uses size and color to depict values. They are helpful for displaying hierarchical data, such as product categories or organizational charts.
For analyzing huge datasets for trends and patterns; TreeMaps are frequently employed in business intelligence.
Calendar Heatmaps
Calendar heatmaps use color to depict values on a calendar. They are helpful for displaying temporal data, such as sales numbers, website traffic, or social media activity. In marketing and advertising, calendar heatmaps are frequently used to spot trends and patterns in consumer activity.
Scatterplot Heatmaps
Color is used in scatterplot heat maps to depict the density of data points. They may be used to visualize big datasets and spot groups of data points. In industries like finance and healthcare, scatterplot heatmaps are frequently used to spot trends and patterns in large amounts of complicated data.
Businesses may employ a variety of heatmap styles to display their data and uncover important insights. Each sort of heatmap has distinct advantages and uses that let organizations pick the best one for the job. Using heatmaps in your data visualization approach may help you make wise decisions and promote company success, whether you’re trying to spot trends in sales data, target advertising campaigns, or improve your website.
Heatmap Tools in Business Intelligence
Business organizations attempting to decipher complicated data might benefit greatly from using heatmaps. Heatmaps may be used in business intelligence to illustrate trends, patterns, and correlations in data that aren’t always obvious from raw data or conventional reports.
So, in this post, we’ll look at the application of heatmaps in business intelligence and how they may provide organizations with a competitive edge.
Visualizing Complex Data
When it comes to displaying complicated data in business intelligence, heatmaps are very helpful. Heatmaps may give organizations a clear and succinct visual representation of their data by utilizing color to indicate numbers, making it simpler to spot trends and patterns. A heatmap of sales data, for instance, may reveal the most popular goods; the best-performing locations, and the busiest seasons of the year.
Identifying Trends and Patterns
Businesses may use heatmaps to see patterns and trends in their data that might not be immediately obvious. Heatmaps enable organizations to detect trends that might not be apparent in conventional reports or spreadsheets by succinctly and clearly presenting data.
For instance, a heatmap of website traffic information might reveal which pages are receiving the most hits, assisting organizations in improved website performance optimization.
Real-Time Monitoring
Businesses may gain immediate insights into their performance via heatmaps. Businesses may immediately discover areas where they need to improve and make modifications on the spot by collecting key performance indicators (KPIs) and displaying data in real-time.
A social media heatmap, for instance, might show companies whose postings are receiving the most interaction, enabling them to modify their social media strategy in real-time.
Improving User Experience
Businesses may also enhance the user experience by using heatmaps (UX). Also, businesses may see places where customers may be having trouble or running into obstacles by monitoring user activity on their website or mobile application.
You can improve the UX by using this data to boost user pleasure and engagement. A heatmap of a mobile app, for instance, might assist firms to identify the most popular features and choose where to focus their future development efforts.
Heatmaps may be used in business intelligence to illustrate trends, patterns, and correlations in data that aren’t always obvious from raw data or conventional reports. Businesses may get a competitive edge by using heatmaps in their data visualization strategy to help them make data-driven decisions that promote growth and success.

Other Useful Measurement Tools
Businesses may utilize a variety of measuring techniques in addition to heatmaps to enhance their performance. These technologies assist companies in gathering information and insights, enabling them to make data-driven choices and streamline their processes. Besides this, we’ll look at a few of these tools and how they may help businesses in this post.
Key Performance Indicators (KPIs)
Businesses use KPIs as a measuring tool to monitor their performance. KPIs are measurements that assist companies in monitoring their progress toward their targets. Also, businesses may easily spot areas where they are lagging behind by measuring KPIs and making adjustments to stay on course. Revenue, customer happiness, staff productivity, and also website traffic are examples of typical KPIs.
Customer Feedback Surveys
Surveys of consumer opinions are a crucial tool for companies trying to increase customer satisfaction. These questionnaires provide businesses the chance to learn what customers think of their goods, services, and overall experience. Businesses may spot areas where they need to improve and take steps to resolve client complaints by studying this input. Net Promoter Score (NPS) surveys, customer satisfaction surveys, and product feedback surveys are examples of common customer feedback surveys.
Website Analytics
Businesses may watch and analyze user behavior on their website with the help of website analytics tools. These tools may give businesses information on the most popular sites; how long visitors stay on each page, and where people leave off. Moreover, businesses may enhance their website to maximize user engagement and conversion rates by evaluating this data. Google Analytics, Adobe Analytics, and Hotjar are also a few well-known website analytics solutions.
Social Media Analytics
Businesses may monitor and evaluate the success of their social media efforts using social media analytics tools. These tools may give businesses information on the postings that are receiving the most attention; the social media sites that are bringing in the most visitors, and the most active demographics.
Moreover, businesses may enhance their social media performance and optimize their social media strategy by studying this data. Besides this, Sprout Social, Hootsuite, and Buffer are examples of well-known social media analytics programs.
Employee Performance
Businesses may monitor staff performance and productivity with employee performance-tracking technologies. These technologies may give firms information about which staff is working well; which individuals require more assistance or training, and which divisions are the most effective.
Businesses may enhance their support and training initiatives and find opportunities to streamline operations by examining this data. Tools for measuring employee performance include Jira, Asana, and also Trello. Businesses may obtain information and insights that will enable them to make data-driven choices and enhance their operations by integrating these technologies into their operations.
Besides this, these technologies may give organizations insightful information and assist them in achieving their objectives; whether they be to boost website engagement, increase customer happiness, or optimize operations.
Conclusion: Real-Time Heatmaps Benefits
We stress the need of utilizing measuring tools in the workplace to obtain information and insights. Businesses may use heatmaps and other measuring tools to spot patterns, streamline processes, and also reach data-driven choices.
Moreover, businesses may increase performance and accomplish their objectives by integrating these technologies into their daily operations. So, you are welcome to follow the advice in this post as you optimize your business.
